The Onion Layers of Knowledge
You don't know what you don't know until you know it. But only then do you realise what got you there.

It was a total surprise to me that a 1999 turn-based strategy game, Heroes of Might & Magic III, is still being actively played today. I’ve spent an illegal number of hours playing it in 2000. As my friend and I had dinner in the Philippines, he briefly mentioned routinely spending several hours a week playing HoMM III with gamers worldwide and that symphonic orchestra concerts covering the game’s soundtracks would be organised for die-hard fans. They would be sold out as quickly as those of Taylor Swift.
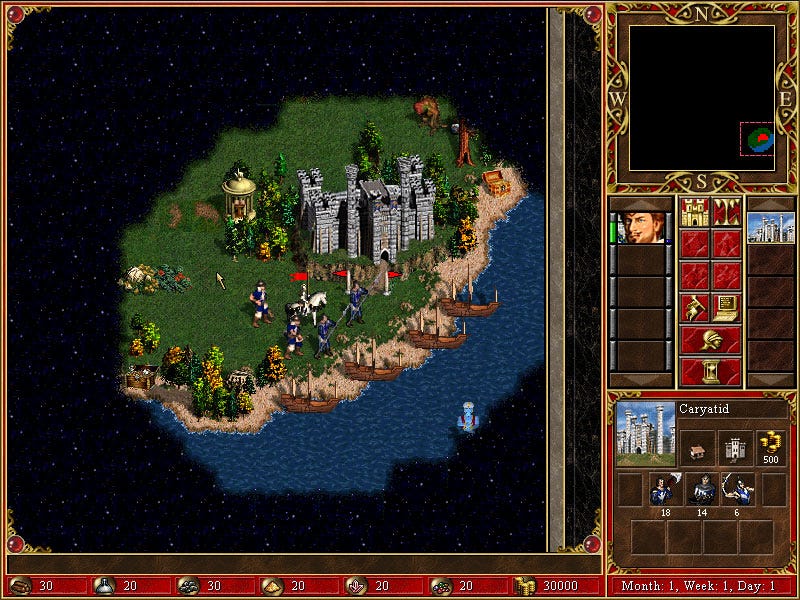
For those who have never played it, the image above demonstrates a typical beginning: you start in a hometown located on a vast map. The upper-right corner shows the entire map, putting your worldview into perspective. Your vision is narrow but expands as knights venture further and discover new artefacts. Until then, you don’t know what you don’t know.
I like to think about knowledge acquisition as adding onion layers, where every subsequent layer builds on the previous one, growing inside out. This resembles a popular software development paradigm, the Onion Architecture. It attempts to make things modular and loosely coupled. In it, dependencies flow inwards. In other words, the outer layers depend on the inward layers, but the inner ones don’t even know the outer ones exist.
This is also very reminiscent of acquiring knowledge. Think about it: you can’t know something until you know it. However, once you know it, you realise it was made possible by a previously existing corpus of knowledge. We can only learn something new if we have the foundations to build these new skills or understanding. Brains are associative mechanisms. To remember and understand things, we must have other things to attach them to.
A layered, iterative approach is an omnipresent pattern you can’t unsee once you understand it. Knowing about its existence is a layer of knowledge upon which you can put new layers. Like many universe-defining paradigms, the onion layers will manifest themselves in random places at different times, similar to the Golden Ratio that can be spotted in flowers, shells, architecture, etc.
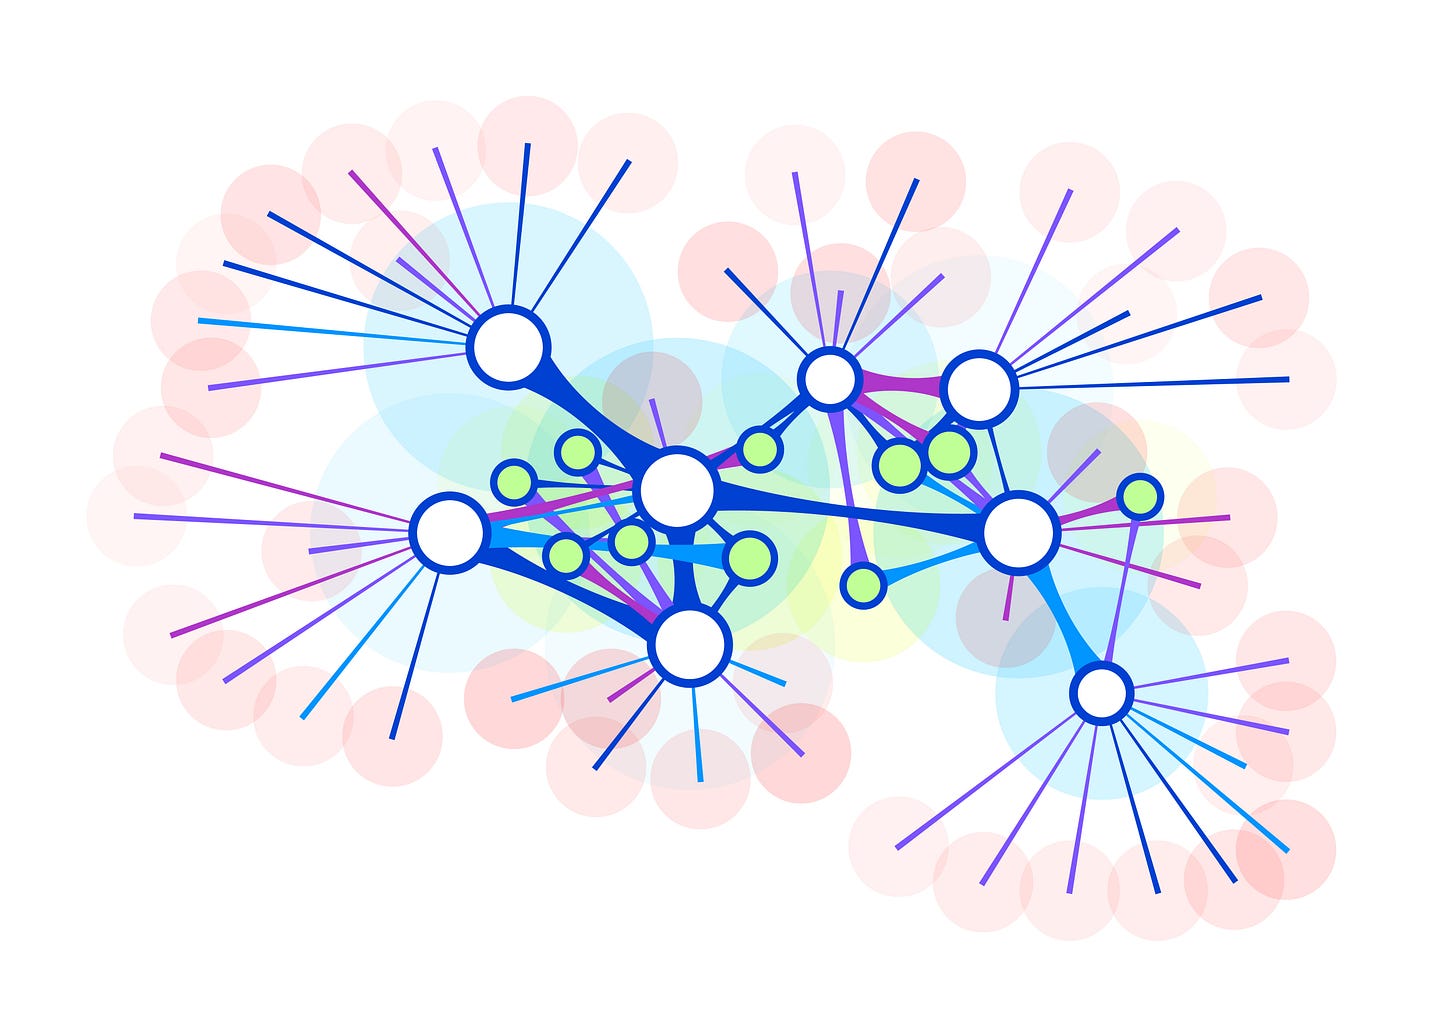
The image of concentric circles is just another way of visualising that new things are being built on top of others. You could very well imagine a stack, such as a TCP/IP stack that makes the Internet possible or a physical building, where the foundation comes before the carrying structure, which, in turn, comes before the roof, etc. You could also take a pizza wedge from concentric circles and picture it as a field of vision stemming from the viewer and widening as it expands. I think of these images interchangeably.
Although I can pick one or the other depending on the context and how simple I want my sketch to be, I often prefer full concentric circles because they make the most sense once overlayed upon a typical knowledge graph.
One of the most popular ways to generate visuals of your knowledge graphs is to use so-called force graphs, where nodes representing information abide by the laws of gravity. The sun, being a more prominent and dominant celestial body, exerts a much greater gravitational pull on planets that orbit it than smaller, less heavyweight stars.
When this algorithm is applied to a knowledge graph, the size of a node and, as a consequence, its gravitational force can be a function of its popularity. In other words, the more a note in your notes vault is referenced, the more weight it gains. This simple principle is also what made Google what it is today. Their PageRank algorithm laid the foundations for the company’s technological dominance in the search engine race. But, in hindsight, this idea (like most brilliant ideas) is elementary: the more a website is linked to, the higher it ranks.
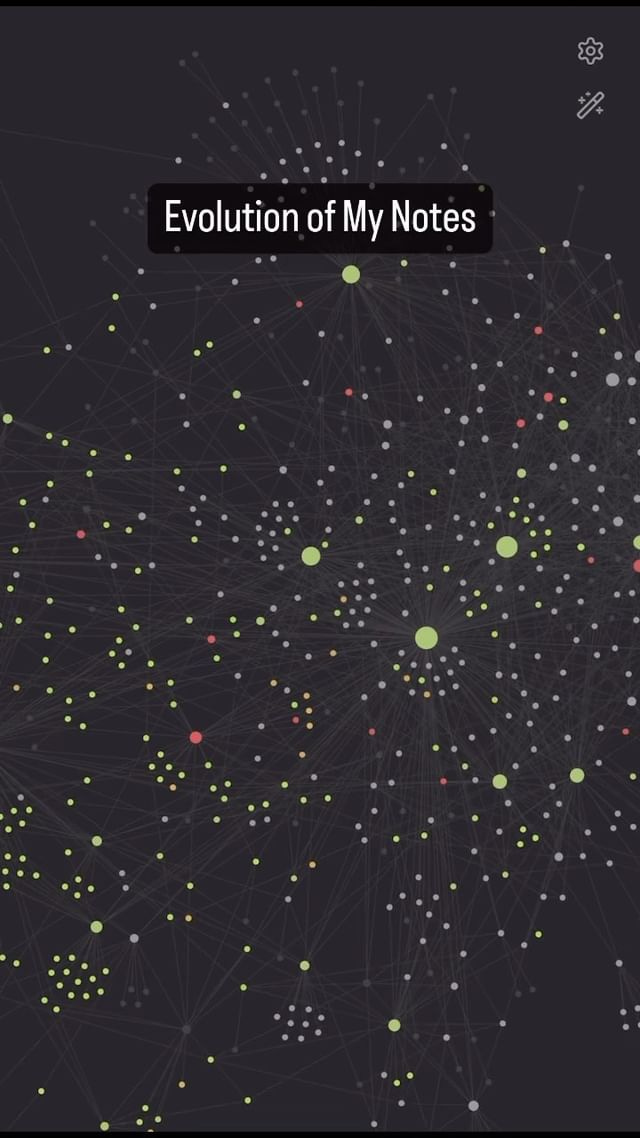
Once you have this “living and breathing” 2D force graph, you’ll notice that those prominent, seminal nodes will start to form, automatically finding their way towards the centre of the graph. As new information enters your knowledge graph, it’ll be connected to nodes already in it. Mixing knowledge from different domains might show several clusters with their independently growing onion layers.

I love Tools for Thought that have force-graph visualisations built in because, as much as they’re simply beautiful to look at, they also indicate knowledge acquisition progress, which is very motivating for continuous learning.
In one of the previous issues, we discussed the attractiveness of personal knowledge graph visualisations.
Obsidian, for example, can even replay the history of how your PKM graph came to be by animating the appearance of the nodes and connections based on their creation date.
There’s a saying that goes like this:
There are three things you can watch forever: fire burning, water falling, other people working...
I’d add a fourth one: the animated reconstruction of one’s knowledge graph…


